KPI Benchmarks for SaaS Sales Teams 2025
Top SaaS sales teams win by prioritizing efficiency, retention, expansion and AI amid longer sales cycles and rising CAC.

KPI Benchmarks for SaaS Sales Teams 2025
SaaS sales teams in 2025 faced longer sales cycles, rising acquisition costs, and more complex deals. Yet, benchmarks reveal how top performers excel. Here’s what you need to know:
- Revenue Growth: Median ARR growth was 19–26%, with top companies hitting 32–50%. Expansion ARR drove 40% of new revenue.
- Efficiency Metrics: LTV:CAC ratios at 3.6:1 were common, but top performers exceeded 5:1. CAC payback periods stretched to 20 months for most, but leaders stayed under 12 months.
- Conversion Rates: MQL-to-SQL conversion averaged 15–21%, with SMBs outperforming enterprises at nearly every funnel stage.
- Retention & Expansion: Net Revenue Retention (NRR) over 120% was a hallmark of leaders, while churn rates were lowest for enterprise customers (1.4% monthly).
- AI Impact: Teams using AI tools reported 28% higher productivity and 18% more pipeline generation.
Key takeaway: Focus on improving efficiency, retention, and expansion while leveraging AI to stay ahead in a competitive market.
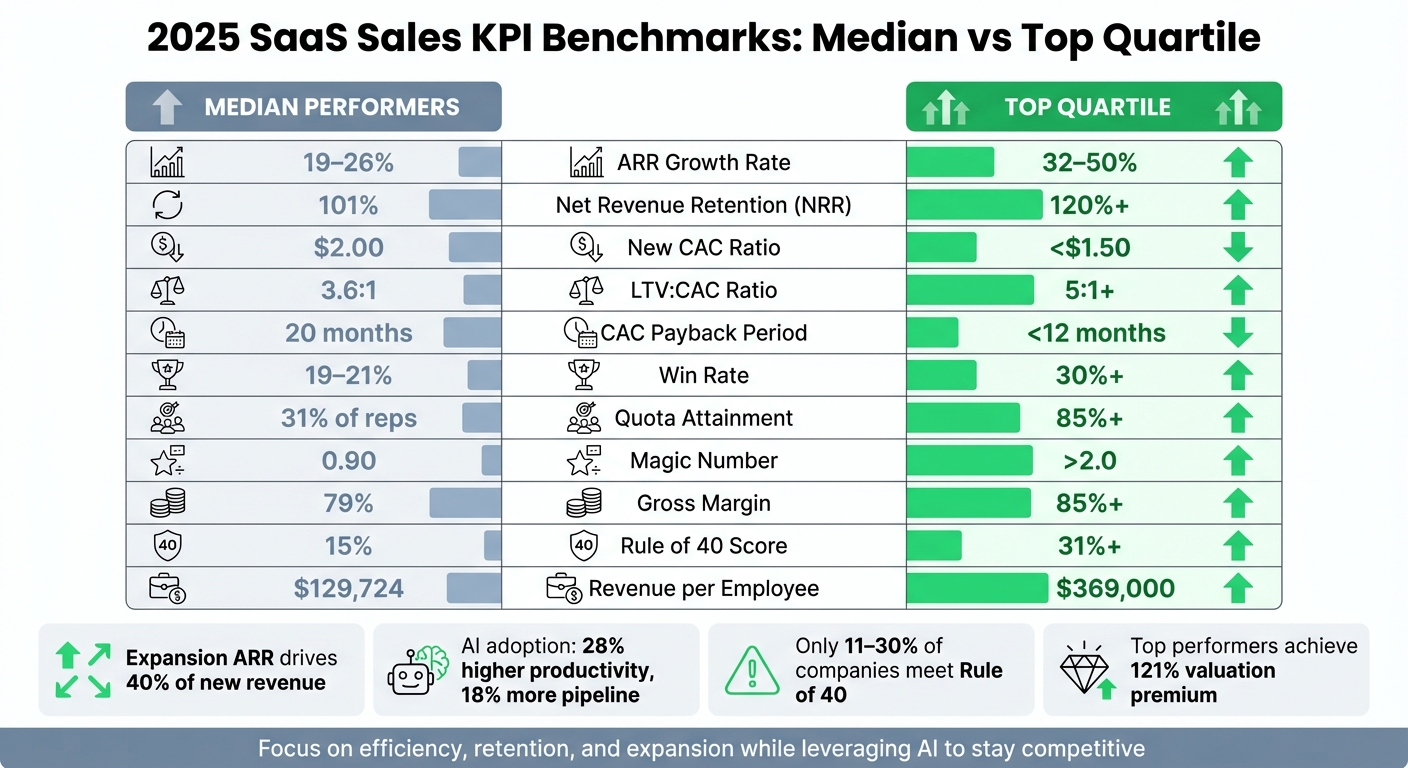
2025 SaaS Sales KPI Benchmarks: Median vs Top Quartile Performance
Revenue-Focused Sales KPIs
Monthly Recurring Revenue (MRR) and Annual Recurring Revenue (ARR)
ARR and MRR remain essential metrics for SaaS businesses, though benchmarks have shifted. In 2024, the median ARR growth rate was 26% [10], with companies targeting a 35% growth rate for 2025. The top-performing SaaS companies now show growth rates between 27% and 50%, a drop from the 60% rates seen in 2023 [10][1]. Larger companies (those with over $50 million in ARR) outpaced smaller firms, growing at 24% compared to 19% for their smaller counterparts [9]. As the RockingWeb Report highlighted:
Larger companies are now growing faster than smaller ones. That flies in the face of conventional wisdom. [9]
Expansion ARR has also become a major driver, now accounting for 40% of median new ARR. For companies with over $50 million in ARR, more than 50% of new revenue comes from existing customers [1]. This trend shows that sales teams must prioritize nurturing and expanding current customer relationships rather than focusing solely on acquiring new customers. Sustainable growth now depends on this balance.
AI-native companies are also shaking up the landscape. Startups with less than $1 million in ARR achieved a median growth rate of 100% in 2024–2025. AI-driven firms are reaching $30 million ARR in just 20 months, compared to the 100+ months it typically takes traditional SaaS companies [9]. If your business isn’t tracking how AI capabilities could impact growth, you might be overlooking a critical opportunity.
Alongside ARR and MRR, understanding customer value through ARPU offers another layer of insight into revenue performance.
Average Revenue Per User (ARPU)
In the B2B SaaS world, ARPU is often measured as Annual Contract Value (ACV) and serves as an indicator of revenue quality [8]. The median ACV for B2B SaaS companies is $26,265 [8][6]. However, this figure varies significantly depending on the company’s funding model and retention rates. For example:
- Equity-backed companies report a median ACV of $35,761, reflecting a focus on enterprise accounts.
- Bootstrapped firms average $23,391, often relying on higher customer volume.
- Companies with strong Net Revenue Retention (100–110%) achieve a median ACV of $44,073, more than double the ACV of firms with retention rates below 90% [8].
Lead sources also play a critical role in shaping ARPU. While inbound leads are 62% more cost-effective, outbound strategies often generate deals that are 50% larger on average [8]. With 81% of leaders reporting increased deal complexity in 2025 [8], many sales teams are favoring outbound approaches targeting high-value accounts. Additionally, 85% of companies are either adopting or experimenting with usage-based pricing models. These models may lower initial contract values but create greater opportunities for long-term revenue expansion [9]. As a result, ARPU benchmarks should account for both initial contract values and potential expansion revenue.
| Segment | Median ACV | Key Driver |
|---|---|---|
| Overall B2B SaaS | $26,265 | Industry baseline |
| Equity-Backed | $35,761 | Enterprise focus |
| Bootstrapped | $23,391 | Volume strategy |
| High NRR (100–110%) | $44,073 | Customer quality |
These ARPU benchmarks provide valuable context for refining both acquisition and expansion strategies, complementing broader revenue metrics like ARR and MRR. Together, they help sales teams align their efforts with sustainable growth goals.
sbb-itb-817c6a5
SaaS Metrics That Matter: NRR, Rule of 40 & Sale-Ready KPIs
Efficiency and Acquisition Sales KPIs
To drive sustainable growth in SaaS sales, it's not just about tracking revenue - keeping acquisition costs efficient is equally critical.
Customer Acquisition Cost (CAC) and Lifetime Value (LTV) Ratios
The classic benchmark for the LTV:CAC ratio has been 3:1, but tighter financial conditions are pushing companies to aim for 4:1 or higher [12][13]. Ratios below 3:1 often indicate inefficiencies in acquiring and retaining customers, while ratios above 5:1 could mean underinvestment in growth, leaving space for competitors to gain ground [11][12][13].
In 2024, customer acquisition costs rose significantly, with the median New Customer CAC Ratio hitting $2.00. This means companies spent $2.00 in sales and marketing to secure $1.00 of new customer ARR. The top quartile reached $2.82 [1][7]. Several factors contributed to this rise:
- A 40% year-over-year increase in Google Ads costs [12].
- Sales cycles extending by 24–32% for mid-market deals and up to 36% for enterprise transactions [7].
- A drop in average win rates, now at 19–21%, compared to 23% in 2022 [7].
The CAC payback period also reflects these challenges. By 2024, the median payback period stretched to 18 months, exceeding the historical norm of 12–14 months [1]. While a payback period under 6 months is considered excellent and 6–12 months good, most teams now fall into the "acceptable" range of 12–18 months [12]. This shift mirrors a broader industry move from prioritizing aggressive growth to focusing on efficient scaling. Investors now favor metrics like the "Rule of 55" (growth rate plus profit margin) over the traditional Rule of 40 [12][7].
| CAC Payback Period | Rating | Implication |
|---|---|---|
| < 6 months | Excellent | Enables rapid reinvestment |
| 6–12 months | Good | A solid target for B2B SaaS |
| 12–18 months | Acceptable | Median range for 2024 |
| > 18 months | Concerning | Creates cash flow pressures |
Top-performing teams don't rely solely on blended metrics. Instead, they segment unit economics by customer type. Companies with strong net revenue retention (100–110%) consistently outperform those with weaker retention [8]. Jacob Kalvo, Co-Founder and CEO of Live Proxies, highlights the importance of keeping CAC low:
A low CAC is an indicator that our outreach efforts really resonate with our potential clients. It empowers us to make data-based decisions with respect to pacing and budget adjustments [14].
Additionally, successful teams focus on disqualifying poor-fit leads early, ensuring their sales efforts are concentrated on high-potential opportunities [7].
Lead Velocity Rate (LVR) and Sales Cycle Length
As acquisition costs rise, tracking lead generation and sales cycle efficiency becomes even more vital. Lead Velocity Rate (LVR) measures the month-over-month growth in qualified leads and serves as a leading indicator of future revenue [16]. A healthy LVR for B2B SaaS companies is defined as 15% or greater month-over-month growth [16]. Without a steady pipeline of leads, Account Executives face limited opportunities, especially when average quota attainment hovers around 70–75% [15][9].
Sales cycles have also lengthened. Enterprise deals now take an average of 180 days to close, while smaller deals typically close in about 75 days. However, shortening the sales cycle to 30–45 days can boost pipeline velocity by 38% [17][6]. High-performing teams aim to close deals within 46–75 days, as cycles exceeding 120 days see a 35% drop in velocity [6].
Several factors contribute to these extended cycles:
- 58% of B2B professionals report longer sales cycles compared to the previous year [18].
- The average buying committee now includes 6.3 stakeholders [18].
- Mid-market deals increasingly face enterprise-level procurement processes, stretching deal cycles to an average of 9 months [18][8].
One effective strategy to counter these challenges is multi-threading - building relationships with multiple stakeholders - which can improve win rates by up to 130% [8]. Engaging key decision-makers, particularly finance leaders, early in the process can also accelerate deal velocity [7].
AI adoption is playing a pivotal role in improving efficiency. SaaS teams using AI report a 28% increase in productivity and an 18% boost in pipeline generation [15]. With 48% of SaaS sales teams now leveraging AI, administrative tasks have been cut by 45% [15]. Teams tracking Product-Qualified Leads (PQLs) also see conversion rates that are 5–6 times higher than those for traditional Marketing-Qualified Leads (MQLs) [9]. As Sophie Ricci, a Lead Generation Expert, notes:
81% of revenue leaders say their team's deals are more complex than ever before in 2025 [8].
Conversion and Pipeline Sales KPIs
Understanding pipeline health means identifying exactly where prospects drop off. Conversion metrics are the key to evaluating how efficiently leads move through each stage - from initial interest to finalizing a deal.
Conversion Rates Across Stages
The MQL-to-SQL transition continues to be the biggest hurdle in 2025, with average conversion rates ranging from 15% to 21% [6]. This stage shows significant variability across companies, with rates spanning from 13% [23] to 45% [15], depending on factors like lead quality and qualification processes. Companies utilizing behavioral lead scoring - tracking website activity and content downloads - achieve MQL-to-SQL rates of 39–40%, nearly three times higher than those relying on basic demographic scoring [19].
Small-to-medium businesses (SMBs) and mid-market SaaS companies outperform enterprise firms at nearly every stage of the funnel. For example, SMBs convert MQLs to SQLs at a rate of 39%, compared to 31% for enterprises [6]. The gap widens further at the opportunity-to-close stage, where SMBs achieve a 39% win rate versus 31% for enterprise deals [6]. Overall win rates have declined in 2025, with most companies now seeing 21–25% success rates, down from 31–40% in 2024 [2]. Lead qualification has overtaken deal execution as the top challenge for sales teams [2].
Speed is critical. Responding to a lead within 5 minutes makes them 21 times more likely to convert than if the response takes 30 minutes [19]. For even better results, responding within one minute increases lead conversions by 391% compared to waiting an hour [19]. Timing also affects closing rates: deals finalized within 50 days have a 47% win rate, while those dragging beyond that drop to 20% or less [2].
Here’s a snapshot of conversion rates across key funnel stages:
| Funnel Stage | SMB / Mid-Market | Enterprise |
|---|---|---|
| Lead → MQL | 41% | 39% |
| MQL → SQL | 39% | 31% |
| SQL → Opportunity | 42% | 36% |
| Opportunity → Close | 39% | 31% |
By keeping an eye on these conversion rates, sales teams can measure their efficiency against industry benchmarks and identify areas for improvement.
Lead-to-Customer Conversion Rate
For B2B SaaS companies, the overall lead-to-customer conversion rate averages between 2% and 5% [6]. SMB-focused businesses achieve slightly higher rates at 2.7%, compared to just 1.0% for enterprise firms [6]. The top-performing 10% of companies reach rates of 6.0% or more [21][22].
The quality of lead sources heavily influences these figures. For instance, website-generated leads convert at 31.3% from MQL to SQL, while email campaigns lag far behind at just 0.9%. SEO-driven traffic generates 2.5 times more SQLs per visitor compared to PPC traffic. Event-sourced leads also stand out, achieving a 40% opportunity-to-close rate, outperforming email leads at 32% [6][19].
In 2025, Sarina Chen, VP of Sales at CloudMetrics - a SaaS company with 120 employees - shortened their sales cycle from 45 days to 28 days. By implementing strategies like free trials, self-serve demos, and automated onboarding, her team boosted their win rate from 22% to 31% [20].
However, the proposal stage remains a sticking point for many sales teams. Around 32% of deals stall due to sticker shock or the involvement of additional stakeholders [20]. Sales leaders who conduct pre-proposal alignment - ensuring budget approval and gauging the likelihood of closure before sending formal documents - report better conversion rates [20]. Tracking these metrics helps businesses stay competitive and measure their performance against industry standards.
Retention and Expansion Sales KPIs
With acquisition costs on the rise, focusing on retention and expansion is becoming a smarter strategy for SaaS companies aiming for steady growth. By 2025, acquiring $1 of new ARR is expected to cost $2.00 [9][1]. In contrast, retention and expansion efforts cost about 50% less [9], making them a more efficient path to growth for successful SaaS companies.
Net Revenue Retention (NRR) and Churn Rate
Net Revenue Retention (NRR) reflects whether the value of your existing customers is increasing or decreasing. An NRR over 100% means revenue from upsells and expansions is outpacing losses from churn. Industry leaders often achieve NRRs above 120%, while the median currently sits at 101% [1][7].
"NRR above 100% means your existing customers are growing faster than you're losing them - the holy grail of SaaS metrics." - Jake Morrison, Head of Growth, RevMine [24]
Churn rates, however, tell a different story depending on the customer segment. Enterprise customers are the most stable, with a median monthly churn rate of 1.4%. This contrasts with 3.4% for mid-market accounts and 5.8% for SMBs [24]. Across all segments, the median monthly churn for SaaS companies is 4.7%, equating to an annual churn rate of 3.5%. This breaks down into 2.6% voluntary churn and 0.8% involuntary churn [25].
Interestingly, most churn - 67% - happens within the first 90 days, emphasizing the importance of effective onboarding [24]. Companies that focus on helping customers achieve their "first value" quickly tend to retain more users. Annual billing also plays a big role, reducing churn by 60-70% compared to monthly contracts by limiting decision points to just once a year [24].
| Customer Segment | Median Monthly Churn | Top Quartile | Bottom Quartile |
|---|---|---|---|
| SMB (<$1K ACV) | 5.8% | 3.2% | 9.1% |
| Mid-Market ($1K-$25K) | 3.4% | 1.8% | 5.7% |
| Enterprise (>$25K) | 1.4% | 0.6% | 2.8% |
The financial benefits of improving NRR are substantial. For every 1% increase in NRR, a company’s valuation can grow by about 18% over five years [26]. Additionally, companies with dedicated Customer Success Managers see as much as 25% higher NRR compared to those without [25].
These metrics underline how retention lays the groundwork for growth, especially when paired with expansion strategies.
Expansion ARR
Retention may keep your revenue steady, but Expansion ARR - revenue from upsells and cross-sells - drives growth. By 2025, expansion revenue is expected to make up 40% of total new ARR on average [25][1]. For companies that have surpassed $50 million in ARR, that figure rises to 58-67% [1][28].
"Beyond roughly $20 million in ARR, expansion becomes the dominant growth engine." - High Alpha [27]
Usage-based pricing models are particularly effective, boosting NRR by 10% and reducing churn by 22% compared to flat-rate pricing [9]. Similarly, multi-product strategies are proving successful, with high-growth companies earning 30-70% of their revenue from expanding into additional product lines [9].
Product-Qualified Leads (PQLs) - users who actively engage with your product - are another key factor. PQLs convert at rates of 20-30%, far outpacing the 6% conversion rate of traditional Marketing-Qualified Leads [9]. Despite this, only 25% of SaaS companies are currently tracking PQLs [9], leaving significant revenue opportunities untapped. Identifying high-engagement users ready for expansion could be a game-changer for many teams.
Benchmark Comparison Table
The table below sheds light on key performance metrics for 2025, helping you measure your KPIs against industry standards. It highlights both median values (typical performance) and top-quartile benchmarks (the best in the field). This comparison can help pinpoint where your business thrives and where there’s room to improve.
"The hypergrowth era is dead... efficient growth beats hypergrowth" [9].
RockingWeb emphasizes that focusing on efficiency over rapid growth is now the winning strategy, as reflected in these updated benchmarks [9].
| KPI Metric | Median Value | Top Quartile |
|---|---|---|
| ARR Growth Rate | 19–26% [1][9] | 32–50% [1][9] |
| Net Revenue Retention (NRR) | 101% [1][7] | 120%+ [9] |
| New CAC Ratio | $2.00 [1][9] | <$1.50 [9] |
| LTV:CAC Ratio | 3.6:1 [9] | 5:1+ [9] |
| CAC Payback Period | 20 months [9] | <12 months [9] |
| Win Rate | 19–21% [9][7] | 30%+ [9] |
| Quota Attainment | 31% of reps [7] | 85%+ [9] |
| Magic Number | 0.90 [9] | >2.0 [9] |
| Gross Margin | 79% [9] | 85%+ [9] |
| Rule of 40 Score | 15% [9] | 31%+ [9] |
| Revenue per Employee | $129,724 [9] | $369,000 [9] |
A closer look reveals stark differences between average and top-performing companies. For instance, while the median CAC payback period is 20 months, top-quartile businesses achieve payback in under 12 months. Similarly, win rates hover around 19–21% for most, but the best performers exceed 30%.
Another standout metric is the Rule of 40. Only 11–30% of companies meet this benchmark, yet those that do enjoy a valuation premium of 121%. These gaps underline the importance of operational efficiency - not just for day-to-day performance but also for boosting long-term valuation. Aligning your strategy with these benchmarks could be the key to unlocking greater success.
How to Use KPI Benchmarks
Using the 2025 benchmarks as a foundation, you can turn raw data into actionable strategies that drive efficiency and growth. The key is to measure your metrics against industry standards and dig into any performance gaps to uncover opportunities for improvement.
However, context is just as important as the numbers themselves. For example, if a seed-stage company sets $700,000 quotas simply because it's the median, they risk demoralizing their team with unrealistic expectations [31]. Instead, treat benchmarks as guideposts. Align your goals with factors like product maturity, brand presence, and the strength of your sales infrastructure. Early-stage companies should focus on metrics like Monthly Recurring Revenue (MRR) and Customer Acquisition Cost (CAC). Meanwhile, more established companies can prioritize Net Revenue Retention (NRR) and expansion revenue [3].
One of the most common bottlenecks in B2B sales funnels is the MQL-to-SQL transition, where conversion rates typically range between 15–21% [6]. Even a small improvement - say, five percentage points - at this stage can lead to a 12–18% increase in closed revenue [6]. Start by auditing this handoff. Make sure leads are properly qualified before they reach sales, and ensure sales teams respond quickly. These small tweaks can make a big difference, potentially boosting revenue by up to 18%.
Using AI Tools for KPI Optimization
AI tools can help identify performance gaps and streamline your processes. For instance, signal-based outreach - triggered by events like funding announcements or leadership changes - converts at four times the rate of generic cold emails [29]. Platforms like SalesMind AI automate this process, cutting down manual research by as much as 90% [2]. These tools monitor prospect signals and launch personalized LinkedIn outreach campaigns at scale.
"The teams winning today are not doing more outreach - they are spending less time on research and more time on conversations." – Salesforce [29]
AI also enhances behavioral lead scoring, moving beyond basic demographic data. By analyzing actions like visits to pricing pages or webinar attendance, AI can increase MQL-to-SQL conversion rates to as high as 40% [29]. Tools like SalesMind AI automatically flag high-intent prospects, allowing sales teams to focus on leads that are most likely to close.
Another powerful tactic is multi-threading - engaging multiple stakeholders within a buying committee. This approach can increase win rates by 130% for deals over $50,000 [4][8]. Teams using AI save an average of two hours per day and are 3.7 times more likely to meet their quotas compared to teams that don’t use AI [30][29]. For deals that close within 50 days, win rates can hit 47%, but this figure drops significantly for longer sales cycles [2]. AI-powered assistants can shave 11 days off sales cycles [2], keeping more deals within that high-conversion timeframe.
Setting Realistic Goals Using Benchmarks
Once AI has streamlined your outreach, use your historical and segmented data to set realistic goals. Start with your historical baseline, factor in growth plans, and gradually increase quotas as your sales processes become more consistent [31]. Focus on addressing specific bottlenecks, like improving the quality of discovery calls or speeding up proposal turnaround times - especially important as deal complexity continues to rise in 2025.
Segment benchmarks by Annual Contract Value (ACV) to ensure you're comparing apples to apples. For instance, a 170-day sales cycle is normal for enterprise deals but would be a red flag for SMB contracts [5]. Comparing $100,000 ACV deals to benchmarks for $10,000 deals can lead to misplaced priorities. Use pipeline velocity as a "north-star" metric to track daily revenue flow. The formula - (Opportunities × Deal Size × Win Rate) / Sales Cycle Length - can help pinpoint areas where intervention is needed [6].
"For every dollar spent on sales training, companies see a return of $4.53." – Hyperbound [4]
Focus on improving the performance of median performers. While 79% of companies increased revenue in 2025, individual sales rep performance hit record lows [4]. Targeted coaching, such as AI-powered roleplays that simulate buying conversations, can reduce ramp-up time by 47% and improve win rates by 19–32% [3][4]. Reviewing your KPIs quarterly, rather than annually, is also crucial. Markets and buying behaviors shift quickly, so what worked last quarter might not be as effective in the next [3].
Conclusion
The KPI benchmarks discussed earlier provide a roadmap for shaping strategic actions in 2025. SaaS sales benchmarks are more than just numbers - they're essential tools for navigating a market that’s becoming increasingly complex. Leaders are facing challenges like longer sales cycles, larger buying committees, tighter budgets, and more intricate deals.
One standout insight? Teams that review pipeline metrics weekly see revenue growth of 34%, compared to just 11% for those conducting ad hoc reviews [23]. The focus isn’t on obsessing over every detail but on using these benchmarks to identify bottlenecks - like the tricky MQL-to-SQL transition - and making targeted changes that could increase revenue by 12–18% [6].
Interpreting benchmarks effectively requires context. For instance, a $2.00 CAC might work well for high-LTV products but could strain SMBs. Segmenting benchmarks by Annual Contract Value (ACV), tracking them regularly, and honing in on areas with the biggest potential for improvement - like the SQL-to-Opportunity stage - can generate quick wins [6].
The top-performing teams of 2025 aren’t just working harder; they’re working smarter. They’re pairing benchmarks with AI-powered tools to automate tasks, personalize outreach, and engage in meaningful conversations. Notably, 83% of teams using AI reported revenue growth, compared to 66% of those who didn’t [5]. Tools like SalesMind AI are making this possible by automating LinkedIn outreach, qualifying leads, and allowing sales teams to focus on activities that drive results. Combining strategic KPI tracking with AI-driven automation offers a clear path to overcoming today’s challenges and achieving sustainable growth.
FAQs
Which KPIs should I prioritize at my SaaS stage?
When it comes to SaaS success, keeping an eye on the right metrics can make all the difference. Focus on win rate, sales cycle length, pipeline coverage, and customer retention.
Why these metrics? They’re essential for gauging revenue predictability and ensuring steady growth. By prioritizing them, your team can not only track performance but also make smarter, data-driven decisions that drive results.
How can I lower CAC payback without slowing growth?
To bring down CAC (Customer Acquisition Cost) payback without slowing your growth, the key lies in sharpening your sales efficiency. Here’s how you can make that happen:
- Increase Deal Size: Larger deals mean higher revenue per acquisition, helping you recover costs faster.
- Boost Customer Retention: Loyal customers stick around longer, reducing the need to continuously spend on acquiring new ones.
- Leverage AI-driven Tools: AI tools can streamline workflows, enhance productivity, and cut down acquisition costs by automating repetitive tasks and uncovering actionable insights.
Industry benchmarks show that blending efficient growth strategies with AI-powered solutions can be a game-changer for accelerating success in the SaaS world.
Where should AI help most in my sales funnel?
AI shines when it comes to fine-tuning lead qualification, streamlining prospecting efforts, and elevating sales coaching. It can pinpoint top-quality leads, tailor outreach efforts on a large scale, and handle follow-ups automatically to increase engagement and speed up sales cycles. On top of that, AI empowers sales teams by analyzing the habits of top performers and delivering real-time coaching tips. This helps bridge performance gaps, move deals forward faster, and enhance overall sales performance.