How to Measure Sales Cycle Efficiency in SaaS
Calculate revenue/day from average deal size ÷ sales cycle length, then use pipeline velocity, conversion rates, and LTV:CAC to optimize.

How to Measure Sales Cycle Efficiency in SaaS
Sales cycle efficiency shows how effectively time and money are turned into revenue in SaaS businesses. It’s not just about hitting revenue goals but about using resources wisely. A healthy efficiency ratio (0.75–1.0) and metrics like LTV:CAC (3:1 or higher) are key indicators of profitable growth. Improving this efficiency directly impacts scalability and investor appeal.
Here’s how to measure and improve it:
-
Formula: Average Deal Size ÷ Sales Cycle Length (days) = Revenue per Day per Deal.
- Example: $10,000 deal size ÷ 45 days = $222.22/day.
- Shorter cycles or larger deal sizes boost efficiency.
-
Other Metrics:
- Pipeline Velocity: Tracks how fast opportunities convert to revenue.
- Conversion Rates: Pinpoint where prospects drop off in the AI sales funnel.
- LTV:CAC Ratio: Measures long-term profitability (ideal: 3:1–5:1).
-
Improvement Strategies:
- Identify bottlenecks (e.g., slow approvals, proposal delays).
- Use automation tools for repetitive tasks.
- Centralize lead data and streamline team workflows.
Tracking these metrics with tools like CRM systems helps identify inefficiencies and refine processes over time. For SaaS businesses, efficient sales cycles lead to faster growth and better cash flow management.
How to Calculate Sales Cycle Efficiency
The Sales Cycle Efficiency Formula
To figure out your sales cycle efficiency, use this formula: Average Deal Size ÷ Sales Cycle Length (in days) [6]. This gives you the revenue generated per day for each deal.
- Average Deal Size: This is the typical revenue you earn from a closed deal. Calculate it by dividing the total revenue from new deals by the number of deals closed during a specific time frame. If you focus on upselling or targeting higher-value customers, you can increase this figure [6].
- Sales Cycle Length: This is the average time (in days) it takes to turn a lead into a closed deal [4]. A shorter sales cycle boosts efficiency since your team can close deals and generate revenue faster without additional resources. The aim is to strike a balance: increase deal size while reducing the time to close.
Sample Calculation for a SaaS Business
Let’s break it down with an example. Imagine a SaaS company that closed 20 deals last quarter, generating $200,000 in total revenue. The average deal size would be $10,000 ($200,000 ÷ 20 deals). If the average sales cycle length is 45 days, the sales cycle efficiency works out to $222.22 per day ($10,000 ÷ 45 days).
This metric becomes even more insightful when you track it over time or test different strategies. For instance:
- If you reduce the sales cycle to 30 days but keep the deal size at $10,000, efficiency jumps to $333.33 per day. That’s a 50% improvement.
- Alternatively, increasing the average deal size to $15,000 while maintaining the 45-day cycle also brings efficiency up to $333.33 per day.
Both approaches yield the same result but involve different strategies - shortening the cycle or increasing deal size.
Next, we’ll dive into other metrics that influence sales cycle efficiency.
sbb-itb-817c6a5
My Top 4 Sales and Marketing Efficiency Metrics You Should Be Measuring | SaaS Metrics School
Additional Metrics That Impact Sales Cycle Efficiency
Beyond the core efficiency formula, these metrics provide deeper insights to fine-tune your SaaS sales process.
Pipeline Velocity
Pipeline velocity measures how quickly qualified opportunities turn into revenue. The formula is: (Number of Qualified Opportunities × Average Deal Size × Win Rate) ÷ Sales Cycle Length. This calculation gives you a dollar-per-day figure, acting like a daily revenue speedometer [7][8].
"Pipeline velocity is a leading indicator of future revenue. While trailing indicators like quarterly sales tell you what happened in the past, velocity helps you forecast what's likely to happen next." - Semir Jahic, CEO & Co-Founder, Salesmotion [7]
Unlike static metrics, pipeline velocity highlights specific bottlenecks. A low velocity often signals deals getting stuck rather than a lack of leads [7][8]. For instance, improving each of the four velocity components (opportunities, deal size, win rate, and cycle length) by just 10% can result in approximately a 46% increase in total pipeline velocity [8]. To enhance this metric, narrow your Ideal Customer Profile to avoid unqualified leads, and analyze pipeline stages to spot delays, such as deals waiting on legal or pricing approvals [8].
Pipeline velocity works hand-in-hand with conversion rate analysis by identifying where the sales funnel slows down.
Lead-to-Customer Conversion Rate
Tracking conversion rates at various funnel stages - like lead-to-opportunity or opportunity-to-close - helps pinpoint where prospects are dropping off [4]. High conversion rates indicate effective lead targeting, while low rates at specific stages, such as demo-to-close, often suggest the need for better personalization or enhanced sales training rather than just increasing lead volume [4].
"Conversion rate can tell a go-to-market team exactly where they need to improve." - Sofia Tyson, Senior Content Manager, Juro [2]
On average, lead-to-close rates hover around 20% across industries, though this varies by sector [2]. Well-optimized funnels can increase conversion rates by 10-15% [4]. To improve, analyze funnel data to identify drop-off points and address them with targeted solutions, such as refining demo presentations or enhancing trial onboarding experiences [4][2]. For trial-to-paid subscriber conversions, a healthy benchmark is around 25% [2].
While conversion rates focus on immediate sales process improvements, the LTV:CAC ratio evaluates long-term profitability.
LTV:CAC Ratio
The LTV:CAC ratio compares customer lifetime value (LTV) to customer acquisition cost (CAC), offering a clear picture of long-term profitability [4][2]. It helps assess whether the resources invested during the sales cycle are justified by the revenue generated over a customer's lifetime [4][2]. For SaaS businesses, an ideal ratio typically falls between 3:1 and 5:1 [4].
| LTV:CAC Ratio | Business Health Status | Action Required |
|---|---|---|
| Below 1:1 | Critical Inefficiency | Revise sales/marketing strategy immediately; unsustainable [4] |
| 1:1 to 2:1 | Low Efficiency | High risk; focus on reducing CAC or improving retention [4][1] |
| 3:1 | Healthy/Benchmark | Standard for sustainable SaaS growth [3][4] |
| 5:1 or Higher | Highly Efficient | Opportunity to scale sales and marketing aggressively [3][4] |
"A high LTV:CAC ratio means the business spends less to secure each customer relative to the revenue that customer brings in over their lifetime." - TestBox [4]
A ratio below 3:1 signals inefficiencies that require immediate action, while 3:1–5:1 represents sustainable growth. To improve this ratio, consider strategies like increasing expansion revenue, offering discounted annual subscriptions to improve cash flow, or introducing tiered pricing models [3]. Even reducing churn by 5% can significantly boost profits and LTV [3].
How to Improve Sales Cycle Efficiency
Focus on addressing inefficiencies to make your sales process smoother and boost conversion rates.
Remove Bottlenecks in Your Sales Process
Start by mapping out your entire sales process to pinpoint where deals are getting stuck. Common problem areas often include proposal creation, contract negotiations, and delayed follow-ups. Analyze how much time deals spend in each stage and prioritize speeding up the slowest ones. For instance, you can use pre-made templates to cut down on proposal preparation time, establish clear approval criteria to simplify contract reviews, and set up automated reminders to ensure timely follow-ups. These steps not only save time but also set the stage for effective automation.
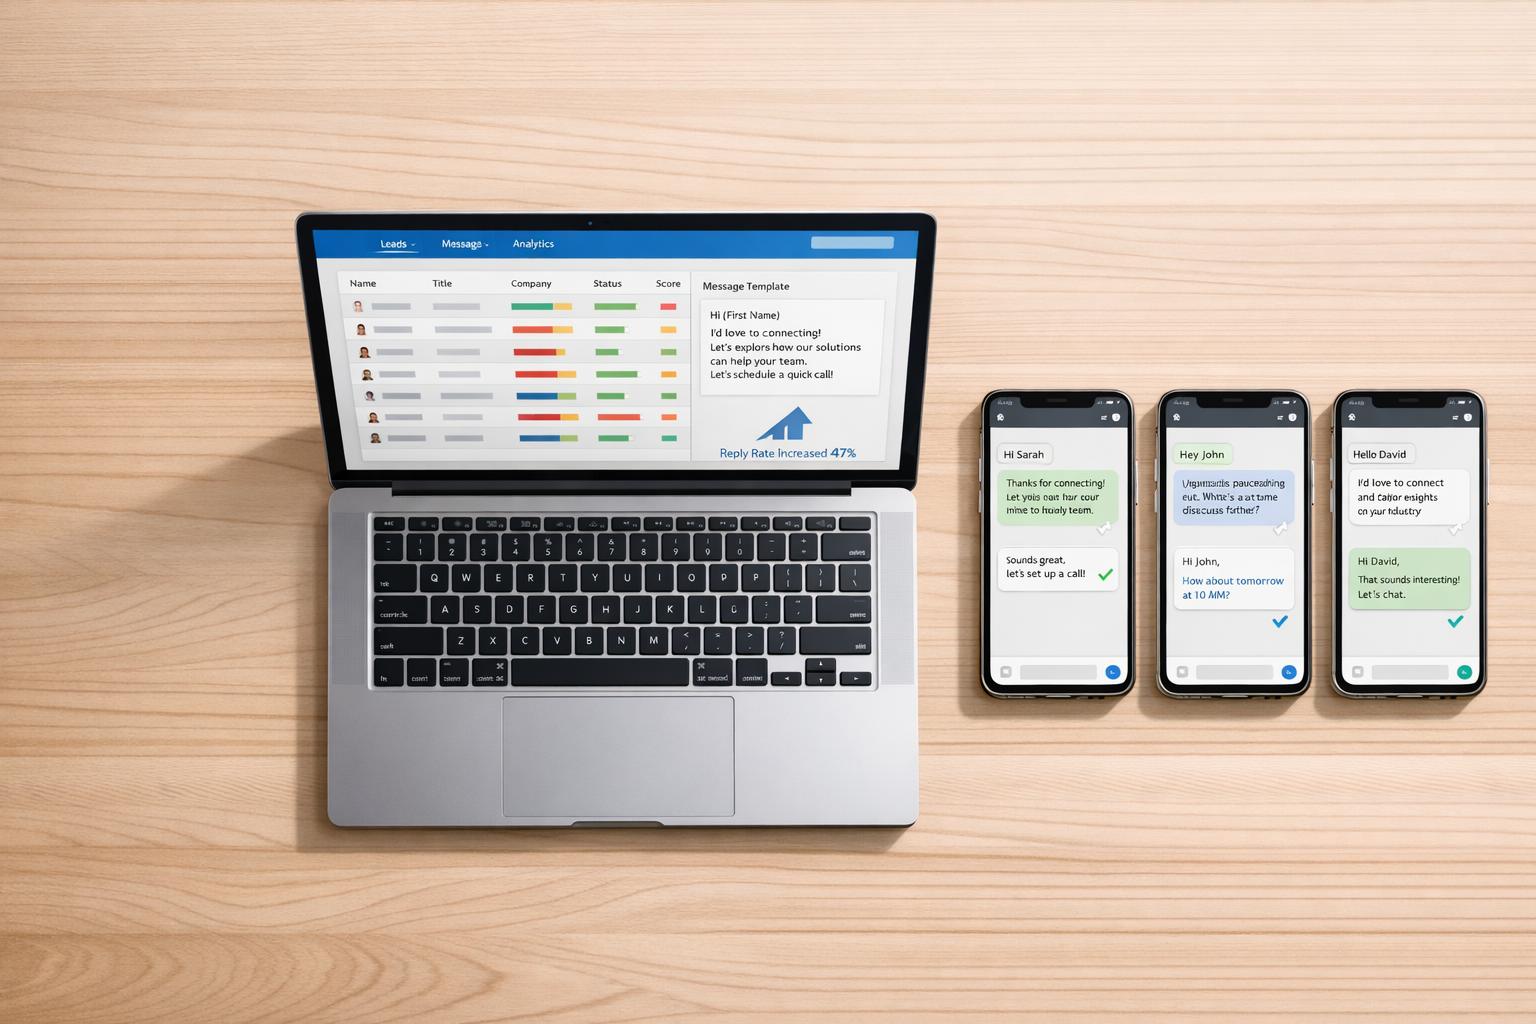
Use AI and Automation Tools
Automation can take care of time-consuming, repetitive tasks, giving your team more time to focus on selling. Tools like SalesMind AI can simplify LinkedIn outreach by automating personalized messages, qualifying leads, and managing follow-ups. It even consolidates LinkedIn conversations into one inbox and uses advanced lead scoring to identify prospects with the highest intent. With these tools, your sales team can spend less time on administrative tasks and more time building relationships with qualified leads.
Improve Team Collaboration and Workflows
Efficiency isn’t just about automation - it’s also about how well your team works together. Centralize all your lead data into one CRM to ensure leads from paid campaigns, events, or referrals don’t get overlooked [9][10]. A scattered system wastes time and risks losing potential opportunities. Standardize the handoff process between business development reps, account executives, and customer success teams by clearly outlining what information needs to be shared and who’s responsible for each step [9]. This helps avoid miscommunication and ensures no lead falls through the cracks.
Additionally, consider using deal rooms - shared spaces where your team and prospects can access proposals, contracts, and technical documents in real time. This approach simplifies collaboration, speeds up decision-making, and reduces delays.
Tracking and Benchmarking Sales Cycle Efficiency
SaaS Sales Cycle Benchmarks by Customer Segment and ACV Range
Monitor Efficiency with CRM and Analytics Tools
Once your sales process is streamlined, the next step is to keep tabs on how efficiently your sales cycle operates. A CRM platform becomes your go-to tool for this, offering a centralized view of all customer interactions - emails, calls, meetings, and more - throughout the journey from initial contact to closing the deal [11]. Automating data entry within the CRM reduces manual errors, which reportedly affect 43% of sales reps [12]. Real-time dashboards provide insights into rep activity, win rates, and deal velocity, helping managers quickly identify pipeline issues and coaching opportunities [12][13].
For instance, businesses using CRM systems in 2026 saw a 34% increase in sales productivity [13], while sales teams leveraging Salesforce-driven processes managed to cut their average sales cycle from 90 days to 63 days [12]. Integrating your CRM with tools like Slack, Microsoft 365, or accounting software further minimizes manual tasks and ensures seamless data sharing across platforms [11].
SaaS Sales Cycle Benchmarks
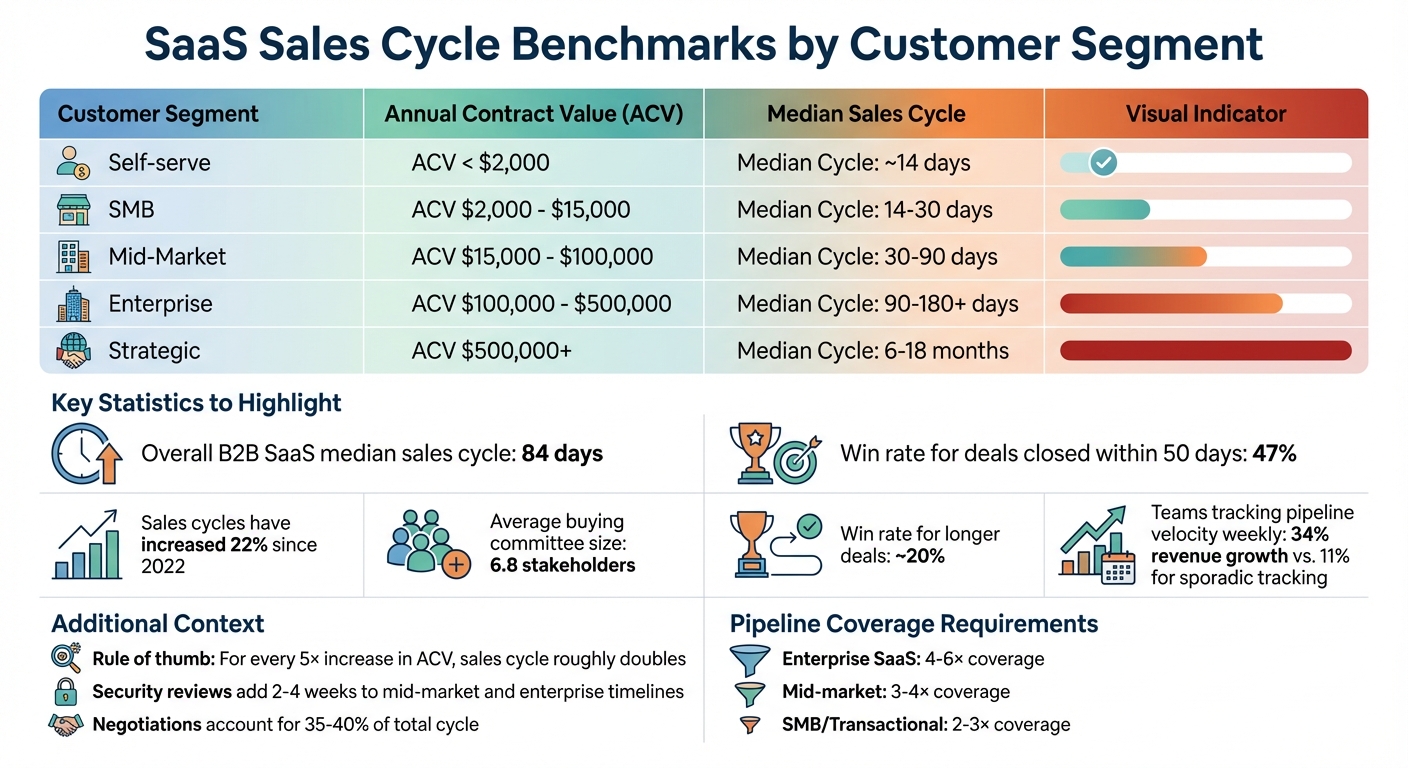
For B2B SaaS companies, the median sales cycle is about 84 days [14][15][16], though some 2025 data suggests it can stretch up to 106 days [17]. Sales cycles have also grown longer - by 22% since 2022 - partly due to buying committees now involving an average of 6.8 stakeholders [14][16]. Instead of relying on averages, which can be skewed by large enterprise deals, use median and percentile metrics to set more accurate targets.
| Segment | ACV Range | Median Cycle Length |
|---|---|---|
| Self-serve | < $2,000 | ~14 days |
| SMB | $2,000 - $15,000 | 14 – 30 days |
| Mid-Market | $15,000 - $100,000 | 30 – 90 days |
| Enterprise | $100,000 - $500,000 | 90 – 180+ days |
| Strategic | $500,000+ | 6 – 18 months |
Monitoring pipeline velocity weekly is critical. Teams that consistently track this metric report 34% revenue growth, compared to just 11% for those who only check it sporadically [14]. Deals closed within 50 days tend to have a 47% win rate, while those taking longer see the win rate drop to around 20% [15]. These benchmarks help you fine-tune your targets based on the complexity of your deals and market dynamics.
Adjust Targets Based on Deal Size and Market
Performance targets should align with the sales model and customer segment. Comparing SMB sales cycles to enterprise cycles doesn’t make sense, as factors like deal size, stakeholder involvement, and industry norms all impact timelines. A general rule of thumb: for every 5× increase in ACV, the sales cycle roughly doubles [14].
Additional factors to consider include security reviews, which can add 2–4 weeks to mid-market and enterprise timelines, and negotiations, which account for 35%-40% of the total cycle [14][16]. For example, if a $25,000 deal takes over 90 days to close, it’s likely a process issue rather than a market-driven delay [14]. Adjust pipeline coverage targets accordingly: enterprise SaaS often requires 4–6× coverage, mid-market 3–4×, and SMB or transactional models can work with 2–3× coverage [13].
Conclusion
Efficiency in the sales cycle is a cornerstone of scalable, profitable SaaS growth. Meghan Spork from TestBox puts it perfectly: "An efficient sales team not only closes more deals but also helps secure consistent growth and scalability. Both of these are essential for a SaaS company's long-term profitability" [5]. Without a firm grasp of how resources translate into revenue, companies risk burning cash in pursuit of growth that ultimately diminishes value.
The key metrics we’ve covered - like the efficiency ratio and LTV:CAC - highlight the importance of a streamlined sales process. Metrics such as a sales efficiency ratio between 1.0 and 3.0 and a Magic Number above 1.0 signal strong performance that appeals to investors [5][18]. These benchmarks serve as a roadmap for evaluating and improving your sales operations.
Efficiency doesn’t just improve internal processes; it strengthens your competitive edge. Companies that refine their sales strategies free up resources for product innovation and market expansion, leaving competitors stuck in inefficient cycles. The focus has shifted from simply tracking activities (like the number of emails sent) to measuring cost-effectiveness - how much revenue is generated for every dollar spent. As Iris AI explains, "It's not about outworking the competition; it's about outsmarting them" [18].
To get started, establish baseline metrics and review them quarterly to uncover bottlenecks and test new strategies. Align your sales and marketing teams around shared goals and a consistent definition of what qualifies as a lead. Reducing friction in your processes - whether by speeding up proposal creation, simplifying contract negotiations, or responding to inquiries faster - can make a huge difference. For instance, responding to leads within five minutes significantly improves qualification rates [18].
Long-term SaaS success depends on efficient and scalable sales systems. By tracking the right metrics and making data-driven adjustments, you’ll build a sales engine that not only drives sustainable growth but also enhances experiences for customers and your team. Tools like SalesMind AI can further streamline efforts, automating personalized outreach and follow-ups to maximize efficiency.
FAQs
What’s the best way to calculate sales cycle length in SaaS?
To figure out your sales cycle length in SaaS, use this formula:
Sales Cycle Length = Total Days in Sales Cycle ÷ Number of Sales
Here’s how it works: track the number of days from the first contact with a prospect to the moment the deal is closed for each sale. Add up all those days, then divide the total by the number of sales. This gives you the average length of your sales cycle, which is a valuable metric for evaluating how efficiently your team is closing deals.
For convenience, you can use a spreadsheet or a calculator to keep everything organized and easily update the data as new sales come in.
How do I know if my sales cycle efficiency is good for my ACV segment?
To gauge how efficiently your sales cycle operates within your Average Contract Value (ACV) segment, it's crucial to compare your sales cycle length against industry benchmarks and analyze how effectively leads are converting.
Here are some key metrics to keep an eye on:
- Sales Cycle Duration: Track how long it takes to close deals. Shorter, consistent cycles often signal better efficiency.
- Pipeline Health: Regularly assess the status and movement of opportunities in your sales pipeline.
- Lead Scoring Accuracy: Ensure your lead scoring system is correctly identifying high-quality prospects.
- Deal Slip Rate: Monitor how often deals are delayed or pushed to later stages.
A sales cycle that’s shorter and more predictable, combined with strong lead conversion rates, is a clear sign of efficiency. On the other hand, lengthy cycles or low conversions can highlight areas that need attention.
Which metric should I prioritize first: cycle length, win rate, or deal size?
Sales cycle length is a key metric that tracks how long it takes to close deals. Reducing this time can accelerate revenue generation and improve sales velocity. When you optimize the sales cycle, it often leads to better outcomes in win rate and deal size. Why? Faster processes make your pipeline more predictable and create opportunities for quicker feedback, helping your team refine their approach. Prioritizing this area can drive the most impactful efficiency improvements in SaaS sales.