Supervised Learning: Steps to Train Lead Scoring Models
Seven-step guide to build supervised lead scoring: prepare CRM data, engineer features, train models, evaluate, deploy, and monitor.

Supervised Learning: Steps to Train Lead Scoring Models
Want to boost sales productivity by 80% and cut wasted time on unqualified leads? Supervised learning can help. By analyzing historical CRM data, this method predicts which leads are most likely to convert using predictive lead scoring. Here's a quick breakdown of the process:
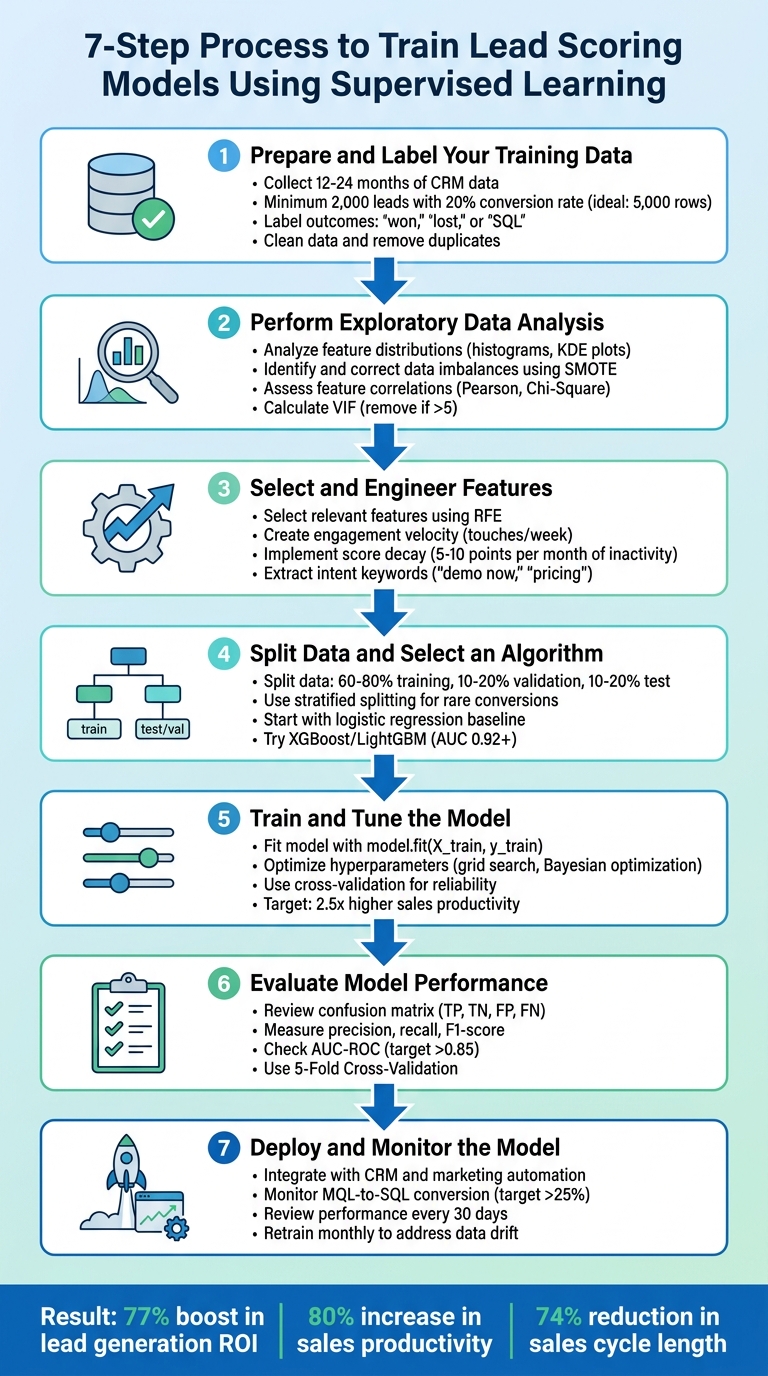
- Prepare and Label Data: Collect 12–24 months of CRM data, ensure quality, and label leads as "won", "lost", or "SQL."
- Explore Data: Analyze patterns, correct imbalances, and identify key features linked to conversions.
- Engineer Features: Create new metrics like engagement velocity or score decay to enhance predictions.
- Split Data & Pick Algorithm: Divide data into training, validation, and test sets. Start with logistic regression, then try advanced models like XGBoost.
- Train & Tune: Fit your model and fine-tune hyperparameters for better results.
- Evaluate Performance: Use metrics like precision, recall, and AUC-ROC to assess accuracy.
- Deploy & Monitor: Integrate into your CRM, monitor metrics, and retrain regularly to maintain effectiveness.
Key takeaway: A well-built lead scoring model saves time, improves efficiency, and increases ROI. Ready to dive deeper? Let’s break it down step-by-step.
7 Steps to Train Lead Scoring Models with Supervised Learning
Build a Lead Scoring Model using Machine Learning in Python
sbb-itb-817c6a5
Step 1: Prepare and Label Your Training Data
The accuracy of your model depends heavily on the quality of your training data. In fact, poor data quality can cost organizations an average of $12.9 million annually [7]. That’s why getting the preparation process right is so important.
Collect Historical CRM Data
Start by gathering 12–24 months of lead data from your CRM system [6]. Ideally, aim for a dataset of 5,000 rows. If that’s not possible, ensure you have at least 2,000 leads with a 20% positive conversion rate [6].
Your dataset should include two main types of data:
- Explicit data: This includes firmographic details like company revenue, employee count, industry, and job seniority [6,10].
- Implicit data: Behavioral signals such as website visits, pricing page views, resource downloads, email engagement, and live chat interactions fall into this category [6].
Before diving in, audit your website forms and tracking scripts to ensure you’re capturing all the necessary criteria [5].
Label Data with Conversion Outcomes
Each record should be labeled with its final outcome - “won,” “lost,” or “SQL” (Sales Qualified Lead) [6]. This labeling serves as your ground truth, the standard your model will rely on for training [8]. To avoid skewed results caused by “false negatives,” exclude leads that haven’t been in your system long enough to reach a definitive outcome. Typically, this means filtering out leads added within the last 3–6 months [15,16].
For more detailed scoring, consider using value-based bucketing. Instead of simple binary labels, segment leads into categories like Bronze, Silver, and Gold based on metrics such as total order value or lifetime value [9]. This allows your model to prioritize high-value leads more effectively.
Clean and Format the Data
The next step is data cleaning. This includes removing duplicates, filling in missing numerical values with the median, and standardizing formats [6]. A real-world example: One IT services provider boosted their lead scoring accuracy from 43% to 76% in just three months by cleaning their data [12].
Sales intelligence tools like Clearbit can help you fill in missing details, such as industry or revenue information [6]. Additionally, reconcile lead and customer records across different sources by matching identity details like names, physical addresses, and phone numbers [10].
"Garbage in, garbage out. Ensure data accuracy and consistency" [11]
- Shivang Gupta, AI & Data Strategy Consultant
With your data properly prepared and labeled, the next step is to conduct exploratory data analysis to identify key patterns.
Step 2: Perform Exploratory Data Analysis
Once your data is prepared and labeled, the next step is exploratory data analysis (EDA). This step is essential for spotting patterns and trends that can significantly improve your model. As data scientist Akash Sharma puts it: "No machine learning model is complete without a proper EDA done over it, as it helps in feature extraction & deletion and decides the best algorithm to develop the model" [13].
Analyze Feature Distributions
Start by studying the distribution of your dataset's features. For continuous variables like "Time Spent on Website", tools like histograms, KDE plots, and boxplots can reveal skewness and outliers [13]. For categorical features such as "Job Title" or "Industry", value counts and count plots can show which categories dominate [13]. To dig deeper, map each feature against your target variable ("Converted"). This bivariate analysis helps identify which attributes are linked to conversion success. For example, "Working Professionals" might show a higher conversion rate compared to "Students."
Replace placeholder values like "Select" with NaN to avoid skewing your results [13]. If you notice right-skewed metrics, apply transformations to normalize the data, which can enhance your model's performance [13].
Identify and Correct Data Imbalances
Take a close look at your conversion rate. If the dataset is heavily skewed toward non-converted leads, the model might favor the majority class, making it less effective at identifying high-value prospects [6][4]. Yashashri Shiral highlights this issue: "The reason we can't ignore this imbalance dataset is it would give a poor performance on the minority class, which is when a customer got converted (yes/1)" [4].
To address this, you can try oversampling methods like SMOTE to generate synthetic examples of the minority class [4]. Alternatively, undersampling the majority class or tweaking your algorithm’s weights to focus more on the minority class can also help [6].
Assess Feature Correlations
Understanding how features relate to conversions is critical for feature selection. For continuous variables, use Pearson correlation; for categorical ones, Chi-Square tests are more appropriate [13][4]. To identify multicollinearity (where features overlap too much), calculate the Variance Inflation Factor (VIF) for all numerical features. Any feature with a VIF above 5 may need to be removed to avoid redundancy and overfitting [4].
Correlation heatmaps are a quick way to visualize relationships between features [13][4]. Pay attention to behavioral signals over demographic data. Research indicates that what leads do often predicts conversions more effectively than who they are [5]. For instance, actions like visiting a pricing page are often stronger predictors of conversion than static traits like job titles. Features with the strongest historical correlation to closed-won deals should take priority in your scoring model [5].
This detailed understanding of your data will guide you in selecting and refining features for the next step in the process.
Step 3: Select and Engineer Features
Once you've wrapped up your exploratory data analysis, it's time to decide which features will drive your model and create new ones that highlight important patterns. As Lucas Correia, CEO & Founder of BizAI GPT, puts it: "80% of model gains come from feature engineering here. Add derived signals: days-to-first-touch, engagement velocity (touches/week)." [6] The features you choose can make all the difference, turning a basic model into one that accurately predicts which leads are likely to convert. After identifying key features, the next step is crafting derived attributes that capture subtle lead behaviors.
Select Relevant Features
Using the insights from your exploratory analysis, focus on the features that best predict conversions. Dive into historical CRM data to uncover trends in leads that successfully converted [6]. Collaborate with your sales team to pinpoint the characteristics and behaviors that signal closed deals. For example, prioritize behavioral indicators like visits to pricing pages over more static data like company size [5][6].
To refine your feature set, apply Recursive Feature Elimination (RFE) to weed out less predictive variables [4]. Use tools like VIF thresholds to identify and remove redundant features [4]. Focus on high-impact behaviors while penalizing attributes that indicate low-quality leads, such as personal email addresses or job titles like "student" [5].
Engineer New Features
Now, turn your raw data into actionable insights by creating dynamic indicators that reflect real-time engagement. Derived features can help translate raw data into probabilities of conversion. For instance, calculate engagement velocity - measuring touches per week instead of total interactions - to flag leads that are gaining momentum [6]. Use exponential decay functions to give more weight to recent interactions while de-emphasizing older ones [6]. Identify intent by extracting keywords from communication, such as "demo now" or "pricing", and converting them into binary features [6].
You can also transform web activity into meaningful metrics, like scroll depth on pricing pages or download frequency. For numerical firmographic data, consider grouping revenue into bins or applying logarithmic scales for metrics like employee count to handle wide variances [6]. Additionally, implement score decay - for example, deduct 5 to 10 points from a lead’s score for every month of inactivity [5]. Companies using tailored predictive models like these often see 2.5x higher sales productivity and experience a 74% reduction in sales cycle length compared to those relying on generic methods [6].
Step 4: Split Data and Select an Algorithm
Now that you've engineered your features, it's time to split your data and pick the right algorithm. Splitting your data ensures your model learns meaningful patterns instead of simply memorizing them. Meanwhile, selecting a suitable algorithm helps uncover the subtle signals buried in your sales data using predictive analytics for lead scoring.
Partition Data into Training, Validation, and Test Sets
Divide your dataset into three parts: training (usually 60% to 80%), validation (10% to 20%), and test (10% to 20%) [14][15]. The training set teaches your model the patterns, the validation set helps fine-tune hyperparameters and spot overfitting, and the test set - kept separate until the final evaluation - provides an unbiased measure of how well your model performs in real-world scenarios [14][15]. Common splits include ratios like 70/15/15, 80/10/10, or 60/20/20 [15].
For lead scoring, where conversions are rare, stratified splitting is essential. This method maintains the conversion ratio across all splits, ensuring balanced data for training and testing [14][15]. If your dataset contains multiple records for the same lead or company, group these together within the same split to avoid data leakage [15]. When working with time-sensitive data, such as lead behavior that changes over time, time-based splitting is a better option. Use older data for training and newer data for testing to mimic real-world forecasting conditions [15].
Be sure to isolate your test set before performing any preprocessing, feature engineering, or data augmentation. This step helps prevent information from leaking into the training process, which could inflate your model's performance [15]. If augmenting data, apply it only to the training set after splitting. Otherwise, you risk introducing duplicate samples into both training and validation sets, which can lead to overly optimistic results [15].
Once your data is properly divided, you're ready to choose the algorithm that will best capture the patterns in your sales data.
Choose a Classification Algorithm
Based on the insights you gathered during exploratory data analysis, select algorithms that can handle both linear and non-linear relationships. Start simple with logistic regression as a baseline model. From there, explore more advanced options like XGBoost or LightGBM, which are highly effective at identifying non-linear patterns in sales data. These algorithms often outperform simpler models, with custom models achieving AUC scores above 0.92 [6].
If your dataset is imbalanced - where "won" outcomes are much rarer than "lost" ones - consider algorithms or techniques designed for such cases. For example, use SMOTE (Synthetic Minority Oversampling Technique) to balance the classes. To achieve high accuracy (AUC 0.92+), custom models typically require at least 5,000 to 10,000 leads [6]. Additionally, stacking models can improve AUC by as much as 15% [6].
Finally, remember to retrain your model monthly to address data drift and ensure it stays effective over time [6].
Step 5: Train and Tune the Model
Now that your data is split and you've chosen an algorithm, it's time to train your model and fine-tune its settings. This is where your algorithm evolves from a basic framework into a tool capable of predicting high-value leads.
Train the Model on Labeled Data
Start by fitting your algorithm with model.fit(X_train, y_train) [6]. This process teaches the model to associate lead features with conversion outcomes. To scale this process, teams often use an AI lead finder to automate the discovery of high-quality prospects before training begins. Begin with a simple baseline model, then move on to more advanced algorithms like XGBoost or LightGBM as needed [6].
If your data is imbalanced (e.g., far more losses than conversions), apply balancing techniques to ensure your model doesn’t lean toward predicting losses disproportionately.
Optimize Hyperparameters
Hyperparameters - like the learning rate, number of trees, or maximum depth - dictate how the model learns and remain constant during training [16][17]. Use grid search (via tools like GridSearchCV) to test all possible parameter combinations, or try random search for quicker sampling [16]. For more complex models, Bayesian optimization tools like Optuna can explore parameter spaces more efficiently, often requiring fewer evaluations to find strong results [16].
Focus on tuning parameters with the greatest impact, such as n_estimators and max_depth for gradient boosting models [16]. Combine hyperparameter tuning with cross-validation to ensure the model performs reliably across different data subsets [16]. Businesses that customize their predictive models often report 2.5x higher sales productivity compared to those using default settings [6].
Validate Model Performance
After training, test your model on the validation set to ensure it performs well on unseen data [6]. This step helps you determine whether the model has genuinely learned patterns or simply memorized the training data. Evaluate metrics like ROC-AUC or precision@85, which measures the percentage of leads scoring above 85 that actually convert [6]. If your AUC score falls below 0.85, consider retraining the model with updated data to address potential drift [6].
Additionally, compare your model's predictions to actual conversion outcomes to verify that the scoring aligns with real-world sales results [2]. Companies that establish a feedback loop between sales teams and their models often achieve 2.3x higher MQL-to-opportunity conversion rates [2].
"AI-powered lead scoring models are only as good as the data they are trained on" [7].
- Jon Miller
Once you've validated your metrics, you're ready to move on to assessing your model's overall performance in Step 6.
Step 6: Evaluate Model Performance
Once your model has been trained and validated, it’s time to see how well it performs in identifying high-value leads. This step involves using specific metrics to measure its effectiveness and ensure it’s ready to integrate into SalesMind AI’s lead automation process.
Use Classification Metrics
Start by analyzing the confusion matrix, which categorizes predictions into four groups: True Positives (TP), True Negatives (TN), False Positives (FP), and False Negatives (FN) [19][4]. Each category provides insights into your model’s strengths and weaknesses. For instance, False Positives can drain sales resources, while False Negatives may cause you to miss promising opportunities [19].
Key metrics like precision, recall, and the F1-score are essential for understanding how accurately your model predicts conversions and for balancing the trade-off between false leads and missed opportunities [4][19]. Additionally, the AUC-ROC (Area Under the Curve) metric measures how well your model ranks positive leads above negative ones [18][19]. A score of 1.0 indicates perfect ranking, while 0.5 means the model performs no better than random guessing [18].
To fine-tune your model, adjust the lead scoring threshold - the point at which a lead is considered "qualified." Optimizing this threshold can help maximize the F1 score, striking a balance between efficiency and lead volume [19]. Use 5-Fold Cross-Validation to ensure your model generalizes well to unseen data, avoiding overfitting to the training set [18].
These metrics will help you identify the most reliable model for your lead qualification process.
Compare Different Models
Evaluating multiple models or configurations side-by-side is crucial. Use your test dataset - typically the most recent 20% of data - for this comparison [19]. Apply the same evaluation metrics across all candidate models to identify the best performer. To understand how each model prioritizes key factors, review feature importance by analyzing model coefficients [18].
Before full deployment, conduct a pilot test. In this phase, the new model operates alongside your existing processes, allowing you to validate its accuracy in a real-world setting [5]. Pay attention to the sales acceptance rate - the percentage of leads that sales reps agree are high quality. A low acceptance rate might indicate that the model is too lenient and requires threshold adjustments [5]. For instance, if your sales team is overwhelmed, you could raise the SQL threshold from 60 to 70 to reduce the lead volume [5].
Investigate outliers to refine your model further. Look at high-scoring leads that didn’t convert and low-scoring leads that did. These cases can highlight missing features or potential biases in your model [5]. Also, make sure the scoring reflects current engagement rather than outdated interactions [5].
"Model performance isn't just about accuracy - we looked deeper into precision, recall, F1 score, and ROC AUC." - TechKene [18]
Step 7: Deploy and Monitor the Model
Once you've evaluated your model's performance, it's time to focus on deployment and ongoing monitoring.
Integrate the Model into SalesMind AI

Deploy your trained model to SalesMind AI for real-time lead scoring. Ensure it integrates smoothly with your CRM and marketing automation tools to keep data flowing seamlessly. This ensures lead scores are updated automatically as new information becomes available.
To build trust among your sales teams, provide clear and transparent explanations for each lead score. When sales reps understand the reasoning behind the scores, they’re more likely to trust and rely on the system. Plus, this transparency helps identify and address potential issues early in the process.
Once integration is complete, shift your attention to continuous monitoring and periodic retraining to maintain the model's accuracy and effectiveness.
Establish Monitoring and Retraining
Set up a system for continuous monitoring to track critical performance metrics. Pay close attention to:
- MQL (Marketing Qualified Lead) to SQL (Sales Qualified Lead) conversion rates, which should ideally exceed 25% [21].
- Deal velocity, ensuring higher-scoring leads close deals faster [21].
- Cost per qualified lead, aiming for a steady decline over time [21].
To keep improving your model, create a feedback loop that uses actual conversion outcomes to refine predictions with behavioral scoring. For new deployments, review performance every 30 days to identify any scoring inconsistencies [22]. Regularly audit your CRM data to ensure essential fields like job title and industry are complete, as missing data can significantly impact accuracy [20]. If win/loss analysis reveals too many false positives or negatives, retrain the model with updated data to address these issues [21][22].
Conclusion
These seven steps lay the foundation for a lead scoring system that replaces guesswork with predictive lead scoring vs. traditional methods to deliver measurable, data-backed results. Companies that implement lead scoring often see a 77% boost in lead generation ROI and an 80% increase in sales productivity [3]. But the real challenge begins after the system is up and running.
Once deployed, your model starts to lose accuracy almost immediately [12]. Factors like market changes, new competitors, and shifting buyer behaviors can quickly diminish its effectiveness. For example, one IT provider saw their model's precision drop from 76% to 68% in just two months after a competitor disrupted buyer patterns [12].
To combat this, continuous monitoring and regular updates are critical. Feed fresh conversion data into the model weekly to ensure it adapts to recent trends [12]. Evaluate metrics like precision, recall, and score distribution monthly to identify issues early [12]. Sales and marketing teams should also collaborate to review cases where high-scoring leads didn’t convert or low-scoring leads did [5][1]. These anomalies often point to new, overlooked predictive factors.
As House of MarTech aptly states, "Predictive scoring is a process, not a project" [12]. Regular adjustments are necessary to keep your model aligned with your evolving customer base. Update point values and scoring criteria quarterly, but limit changes to one or two variables at a time to measure their impact effectively [1]. This ongoing cycle of refinement ensures your lead scoring system stays relevant and continues delivering results over time.
FAQs
What should I do if my CRM data is incomplete or messy?
If your CRM data is all over the place or missing key details, the first step is to clean it up. Make sure the data is accurate, consistent, and well-organized before diving into building a lead scoring model. Keeping your data updated and fine-tuned regularly will help ensure your lead prioritization efforts hit the mark and deliver better results.
How do I choose the right lead score cutoff for SQLs?
Selecting the best lead score cutoff for identifying Sales Qualified Leads (SQLs) requires a mix of data analysis and strategic adjustments. The goal is to pinpoint a threshold that boosts both conversion rates and sales efficiency.
Start by diving into key metrics like conversion rates, return on investment (ROI), and the length of your sales cycle. Historical data can be a goldmine here - look for patterns that show where leads are most likely to convert. This helps you set an initial cutoff point that aligns with past successes.
But don’t stop there. Keep refining your threshold with ongoing testing. Machine learning tools can also play a big role, helping you adapt the scoring model as your sales goals evolve and your market conditions shift. This combination of analysis and flexibility ensures your lead scoring system remains effective over time.
How often should I retrain my lead scoring model?
Retraining your lead scoring model on a regular basis is key to keeping it accurate and relevant. This process should be triggered by a drop in prediction accuracy, the availability of new data, or shifts in market conditions. While there’s no set rule for how often to retrain, updating the model every few weeks or months is a good practice. This helps the model stay aligned with changing lead behaviors and avoids issues like overfitting or underfitting. By doing so, you can ensure that high-value leads are consistently identified and prioritized effectively.