AI-Powered Dashboards for SaaS KPI Tracking
Automate SaaS KPI tracking with AI dashboards that centralize data, send real-time alerts, and deliver predictive sales insights.

AI-Powered Dashboards for SaaS KPI Tracking
AI-powered dashboards revolutionize how SaaS businesses track KPIs by automating data collection, analysis, and reporting. These tools save time, reduce errors, and provide actionable insights in real time. Here's what makes them essential:
- Centralized Data: Automatically integrates data from tools like CRMs, marketing platforms, and finance systems.
- Real-Time Updates: Flags issues like stalled deals or rising churn as they happen, enabling quick action.
- AI Insights: Predicts trends, scores leads, and offers next steps to improve metrics like pipeline velocity and win rates.
- Boosts Efficiency: Cuts down on manual tasks, doubling the time sales teams spend selling.
Companies using AI dashboards report faster sales cycles, higher lead conversions, and more accurate forecasts. The key to success? Clean data, tailored dashboards, and proper team training with AI tools.
AI Powered SaaS Metrics Dashboard
sbb-itb-817c6a5
How AI-Powered Dashboards Fix SaaS KPI Problems
AI-powered dashboards tackle the inefficiencies of manual data tracking by automating how data is integrated and analyzed. Instead of scrambling to gather information from various platforms, these systems directly connect to tools like your CRM, marketing software, finance systems, and support platforms using APIs and universal data integration [3][5]. This creates a single, automatically updating source of truth.
Centralized Data from Multiple Sources
One of the biggest challenges with manual data consolidation is keeping everything in sync. AI simplifies this by pulling together scattered data into one unified dashboard. While 78% of companies offer dashboards in their software, most fail to effectively sync data across platforms [5]. AI solves this problem with "AI-Based Object Association", which can map activities to the right records - even when the data is messy or duplicated [2].
These systems also capture "dark data" - the kind of information manual processes often miss - by pulling details from calls, emails, and platforms like Slack [2]. For example, automated CRM managers can extract insights from conversations and interactions, ensuring no data slips through the cracks.
This streamlined approach doesn't just save time - it also cuts costs tied to manual tasks [2]. By delivering insights directly into tools like Slack or email, AI eliminates the need to constantly switch between different platforms. The result? Real-time monitoring of your key metrics, all in one place.
Automated Real-Time Tracking
AI dashboards keep your data synchronized in real time, alerting you to problems as they happen. For instance, if a deal has been idle for too long or there's an unexpected gap in your forecast, the system will flag it immediately [3]. Instead of relying on outdated weekly reports, you get plain-language summaries explaining exactly what's going on. If pipeline velocity slows or churn rates spike, the AI provides clear, actionable insights [3].
This automation frees up your team to focus on selling rather than updating spreadsheets. It delivers continuous, up-to-date insights without the delays and errors that come with manual tracking.
AI Recommendations and Predictions
AI dashboards go beyond tracking - they also offer actionable insights and predictive guidance. For example, predictive deal scoring uses historical data to forecast outcomes and identify bottlenecks. Natural language processing can analyze emails and call transcripts to detect buying signals or potential risks [6].
If a high-value deal stalls, the system doesn’t just notify you - it suggests next steps based on how similar deals were successfully closed [6]. The impact of these tools is significant. One B2B company increased lead conversion rates by 40% after adopting machine learning-based lead scoring, while another SaaS company saw a 15% boost in conversions by using predictive analytics to fine-tune subscription tiers [6]. AI tools can also double a seller's productive selling time, increasing it from 25% to around 50% [6]. Additionally, generative AI is projected to drive a 3–5% increase in global sales revenue [6].
"AI-Native Revenue Orchestration (Gen 4) replaces passive dashboards with autonomous agents that update CRM fields, generate board-ready forecasts, and coach 100% of calls." - Oliv.ai [2]
The shift is clear: instead of tools you manage, you now have AI agents that do the managing for you [2].
Using AI Dashboards for SaaS Sales Teams
Sales Workflow Transformation: Before vs After AI Dashboards
Sales teams spend more than 70% of their time on administrative tasks, leaving less than 30% for actual selling [6]. AI dashboards flip this dynamic by automating tasks like data entry, lead prioritization, and reporting. This shift allows sales reps to dedicate more time to what truly matters: closing deals.
Key Sales KPIs to Track with AI
Tracking the right KPIs can make a huge difference. Teams monitoring 5–7 core metrics achieve an average quota attainment of 91%, compared to just 73% for those tracking 0–3 metrics [7]. The focus should be on metrics that provide insights into future performance rather than just past results.
- Pipeline velocity: This metric measures how quickly deals move through the pipeline and is a strong predictor of future revenue. Teams that prioritize pipeline velocity see 23% faster revenue growth [7].
- Win rate: By analyzing the percentage of closed-won deals, sales teams can identify areas needing improvement, such as lead qualification or sales training [7].
- Pipeline coverage: To reliably meet revenue targets, the pipeline value should be 3–4 times the revenue quota [7].
- Sales cycle length: This metric highlights bottlenecks in the process. AI tools can identify risks in communication that may delay deals, allowing for timely adjustments [6][7].
- Lead-to-customer conversion rate: AI-driven lead scoring can significantly improve this metric by focusing on high-probability leads [6][7].
- Forecast accuracy: Only 7% of sales organizations achieve 90% forecast accuracy. AI improves this by analyzing patterns in large datasets, helping teams predict market changes and allocate resources effectively [6].
Additionally, leads contacted within 5 minutes are nine times more likely to convert [7]. AI dashboards ensure timely follow-ups by sending real-time alerts when new leads are identified, keeping prospects engaged.
These KPIs lay the groundwork for a more efficient workflow, as shown in the next section.
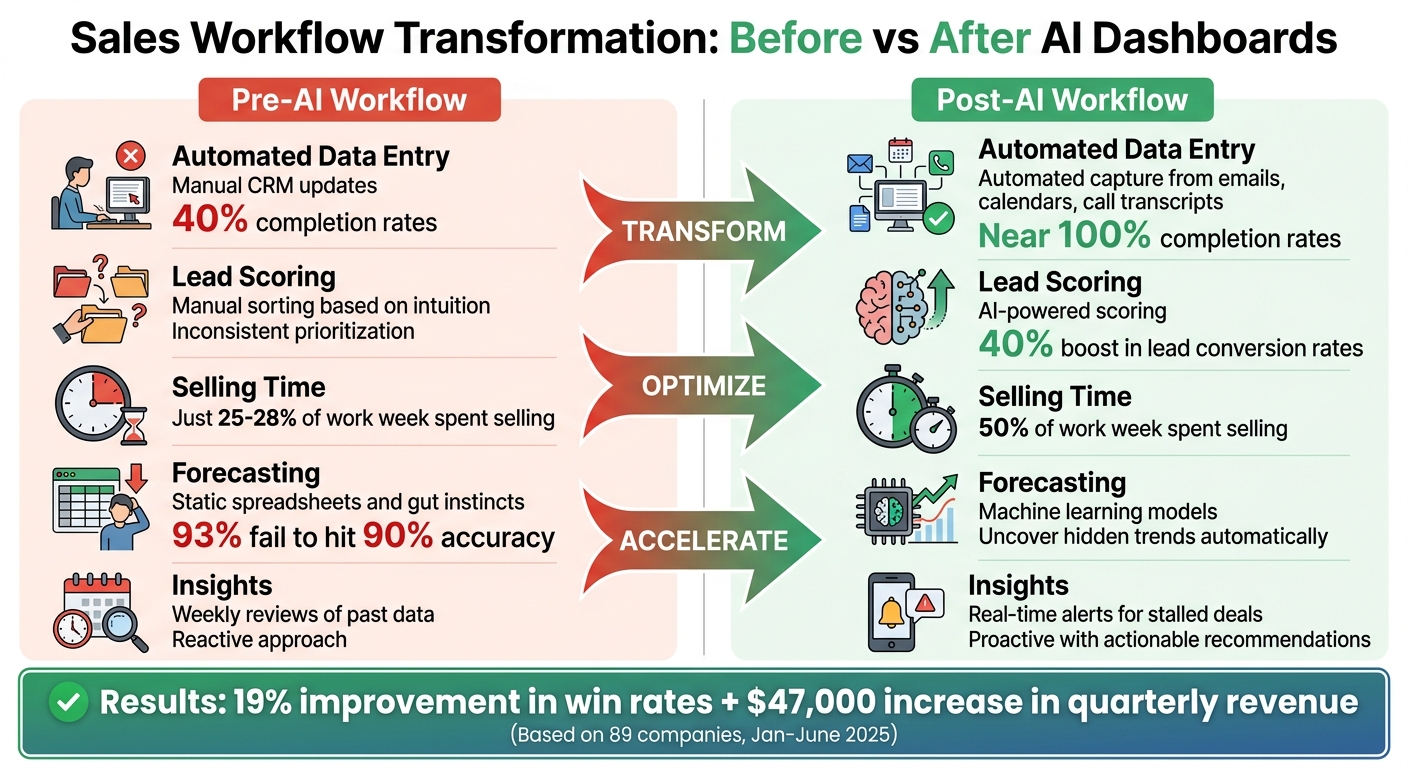
Before and After: Workflow Changes with AI Dashboards
AI dashboards dramatically transform daily sales operations. Here's a side-by-side look at how workflows improve:
| Feature | Pre-AI Workflow | Post-AI Workflow (with AI Dashboards) |
|---|---|---|
| Automated Data Entry | Manual CRM updates, with only 40% completion rates [6] | Automated data capture from emails, calendars, and call transcripts [6] |
| AI-Driven Lead Scoring | Sorting leads manually or based on intuition | AI-powered scoring, boosting lead conversion rates by 40% [6] |
| Selling Time Increase | Just 25–28% of the work week spent selling [6] | Selling time jumps to 50% of the work week [6] |
| Predictive Forecasting | Static spreadsheets and gut instincts; 93% fail to hit 90% accuracy [6] | Machine learning models that uncover hidden trends [6] |
| Real-Time Insights | Weekly reviews of past data, often reactive [6] | Real-time alerts for stalled deals, with actionable recommendations [6] |
The results speak for themselves. Between January and June 2025, 89 companies (with a median of 12 reps per team) implemented a structured KPI tracking framework. This led to a 19% improvement in win rates and a $47,000 increase in quarterly revenue [7].
"Sellers with access to AI tools can increase their selling time from the current baseline of 25% to approximately 50% of their working time, effectively doubling productive selling hours."
Building on these improvements, tools like SalesMind AI enhance LinkedIn outreach to further elevate sales outcomes.
Improving Sales KPIs with SalesMind AI
LinkedIn is a goldmine for qualified leads, but managing campaigns manually limits its potential. SalesMind AI automates LinkedIn outreach, from the first contact to follow-up sequences.
The tool’s engagement scoring identifies the most active prospects on LinkedIn, helping sales teams prioritize conversations with those showing the highest interest [8]. In January 2026, SalesMind AI launched two features to streamline workflows: automated engagement scoring and a Draft Replies tool [8]. These features simplify campaign management and speed up response times. Instead of crafting individual replies, sales reps can review AI-drafted responses and send them with a single click, maintaining a consistent tone while saving time [8].
Best Practices for Using AI Dashboards in SaaS
Successfully integrating AI dashboards into your SaaS operations requires more than just advanced tools. You need reliable data, tailored dashboards, and a team that knows how to use them effectively. Even the most advanced AI can falter with poor inputs or untrained users. Here’s how to make these tools work for you.
Maintaining Data Accuracy and Consistency
Accurate data is the backbone of any AI dashboard. If your data is outdated, incomplete, or inconsistent, the insights you get will be unreliable. To avoid this, connect all your data sources - marketing, sales, finance - into one unified platform. This ensures everyone is working with the same numbers [9][13].
For example, in 2025, Publicis Sport & Entertainment transitioned from manual reporting to real-time analytics by integrating live data. This saved them over 1,000 hours in just one year and cut client onboarding time from six months to under three weeks [9]. Similarly, Schneider Electric created a Performance Management Office in 2024 to ensure KPIs stayed aligned with their business goals [11].
"If the data is outdated, incomplete, or inconsistent, even the most beautiful dashboard will crumble."
Automating data ingestion is key. Tools like Snowflake or BigQuery can connect dashboards directly to live data warehouses [9][14]. AI-powered anomaly detection can also help by flagging unusual spikes or drops in metrics, ensuring potential issues are caught early [9].
Organizations with strong measurement frameworks are three times more likely to see meaningful ROI from their AI investments [12]. Yet, 60% of managers believe they need better KPIs to make smarter decisions [11]. Once your data is clean and consistent, you can focus on tailoring dashboards to meet specific team needs.
Customizing Dashboards for Your Business
Dashboards are most effective when designed for specific roles. Start by identifying who will use the dashboard and the questions they need answered daily [15][10]. For instance, a sales manager might need to track pipeline velocity and regional win rates, while a sales rep may focus on personal quota progress and lead prioritization [16].
Keep each view simple, focusing on a few actionable KPIs to avoid overwhelming users. Companies using sales analytics dashboards have reported a 23% boost in sales performance and an 18% improvement in sales forecasting accuracy [16].
| Role | Key KPIs to Display | Actionable Outcome |
|---|---|---|
| Sales Manager | Pipeline velocity, Win rate by segment | Reallocate resources to underperforming regions [15][16] |
| Sales Rep | Personal quota progress, Lead scores | Prioritize high-probability deals for the day [16] |
| Founder/CEO | MRR growth, LTV:CAC ratio | Strategic planning and investor reporting [15] |
Design matters too. Use the "F-pattern" layout - place critical metrics in the top-left corner, where users naturally look first [17]. If you’re using AI to generate custom views, be specific. Instead of asking for "a sales dashboard", request something like "a dashboard showing MRR, churn rate, and trial conversions for the CEO, built in React with Tailwind CSS" [4].
"A dashboard is only as useful as the decisions it helps you make."
- Ka Ling Wu, Co-Founder & CEO, Upsolve AI [15]
Once dashboards are customized, the next step is ensuring your team knows how to use them effectively.
Training Teams to Use AI Tools
A well-designed dashboard is useless if your team doesn’t know how to leverage it. Start by defining the business questions the dashboard should answer, such as "Why did revenue dip last month?" or "Which region grew the fastest?" [10].
Encourage your team to use natural language prompts effectively. Vague questions lead to vague answers, while specific prompts like "What is our average customer lifetime value for enterprise versus basic plans?" yield better insights [1]. In 2025, Aampe revamped its dashboard with Eleken, replacing dense tables with bubble charts and sparklines. This redesign made it easier for clients to understand performance trends at a glance [10].
Train teams to build dashboards step by step. Begin with a basic layout, then add metric cards, and finally integrate charts and tables [4]. Each metric card should include three elements: a clear label, the current value, and context (e.g., "up 12% vs last month") [17]. Use realistic sample data, like "Acme Corp", during training to make sessions feel professional and actionable [4].
Data literacy is equally important. Teams need to understand why a churn risk is flagged or how the AI arrived at a specific prediction [10][1]. Without trust in the data, the dashboard’s usefulness quickly diminishes. Proper training ensures dashboards deliver their full potential. For instance, well-trained teams using dashboards have seen a 15% boost in quota attainment and a 27% improvement in pipeline management [16].
Conclusion
AI-powered dashboards are transforming the way SaaS companies handle KPI tracking. By automating the process of consolidating data from platforms like Stripe, Salesforce, and Google Analytics, these tools eliminate the tedious, time-consuming task of manual data collection. Instead, they provide a single, reliable source for tracking performance metrics [1][3].
The real game-changer lies in how AI shifts teams from reactive to proactive decision-making. These dashboards don't just display data - they predict trends, identify at-risk deals, and even suggest next steps. When issues arise, team members are alerted instantly, allowing them to take action before problems escalate [18].
For SaaS sales teams, the results are clear. Companies leveraging AI-driven lead scoring report conversion rate improvements of 10% to 30%, with sales cycles shortened by as much as 23% [19]. Tools like SalesMind AI highlight these advantages by combining advanced lead scoring with LinkedIn outreach automation, helping teams prioritize high-value opportunities and respond faster.
Clean, unified data plays a critical role in achieving these outcomes. Organizations with well-organized data are 58% more likely to exceed revenue goals, and sales efficiency can improve by 15% when AI reduces administrative tasks [19]. As Spencer Lanoue puts it:
"AI-powered tools can do the heavy lifting, turning a multi-day project into a matter of minutes" [1].
The future isn’t about adding more dashboards - it’s about creating AI agents that actively monitor data and drive timely action. By moving from report-building to insight analysis, your team can focus on what matters most: closing deals and optimizing key metrics like Monthly Recurring Revenue (MRR) and Customer Acquisition Cost (CAC) [1].
FAQs
Which KPIs should a SaaS team track first in an AI dashboard?
In an AI-powered SaaS dashboard, focus on KPIs that showcase the overall health and growth of the business. Key metrics to monitor include Monthly Recurring Revenue (MRR), Customer Acquisition Cost (CAC), and Churn Rate. These provide insights into revenue consistency and customer retention. Additionally, keeping an eye on Customer Lifetime Value (CLV) and the health of your sales pipeline offers a better understanding of long-term profitability and operational efficiency. Starting with these metrics ensures you have a clear view of performance to guide strategic decisions.
How do AI dashboards keep KPI data accurate across multiple tools?
AI dashboards make it easier to trust your KPI data by pulling information from multiple sources into one clear, centralized view. They handle updates automatically, reducing the risk of human error. Plus, with predictive analytics, these dashboards deliver real-time insights that are both timely and accurate. This ensures your data stays consistent and dependable across all your tools.
How can SalesMind AI improve LinkedIn lead follow-ups and conversions?
SalesMind AI transforms LinkedIn lead follow-ups and conversions by automating personalized outreach, tracking engagement in real time, and triggering follow-ups based on how leads interact. This strategy can boost reply rates by up to 67%, improve lead qualification scores, and free up valuable time for sales teams to focus on closing deals.